
Most over-valued & under-valued Crypto Assets
Most over-valued & under-valued Crypto Assets
Price to Earnings ratios (P/E) and Price to Sales ratios (P/S) are used to identify if a Crypto Asset is over-valued or under-valued.


Price to Earnings ratios (P/E) and Price to Sales ratios (P/S) are used to identify if a Crypto Asset is over-valued or under-valued.
1. Price to Earnings ratio (P/E)
Price-to-earnings (P/E) ratio is the fully diluted market cap (FDMC) divided by annualized protocol revenue (APR).
P/E = FDMC / APR
Protocol revenue is the money generated from a protocol's business and then either allocated to its treasury or distributed to token holders. APR is calculated as the protocol revenue over the previous 30 days multiplied by 365/30.
2. Price to Sales ratio (P/S)
Price-to-Sales (P/S) ratio is the fully diluted market cap (FDMC) divided by annualized total revenue (ATR).
P/E = FDMC / ATR
Total revenue is equal to the total fees paid by the users. ATR is calculated as the total revenue over the previous 30 days multiplied by 365/30.
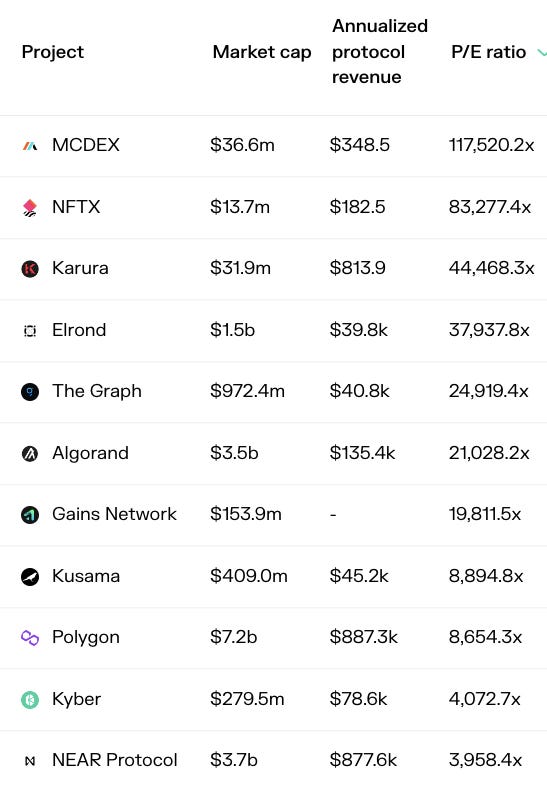
3. Most over-valued Crypto Assets
The most over-valued cryptos by P/E ratio are:
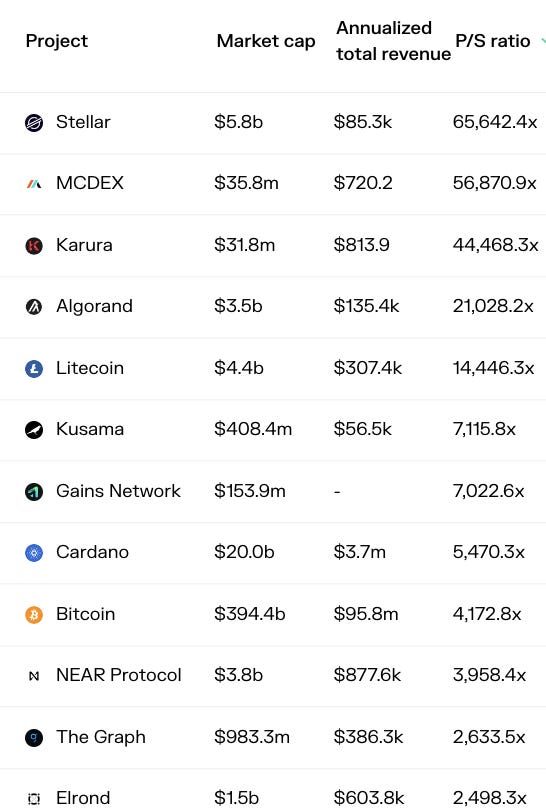
The most over-valued cryptos by P/S ratio are:
4. Most under-valued Crypto Assets
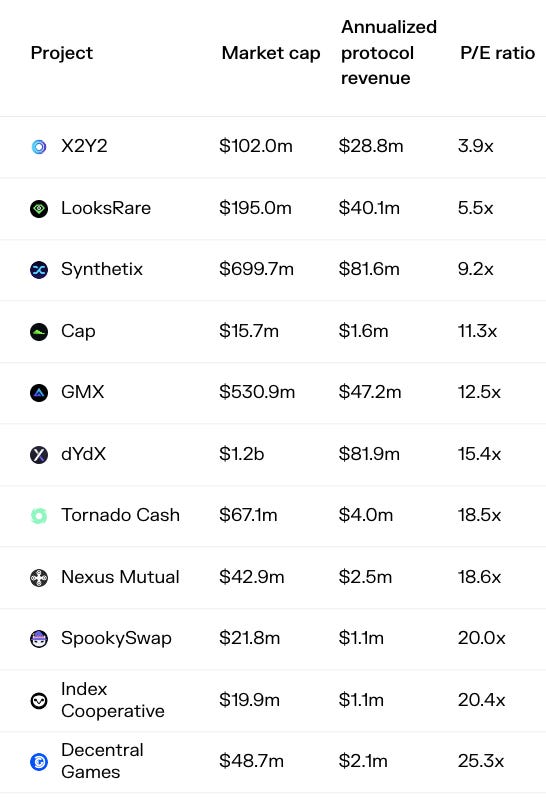
The most under-valued cryptos by P/E ratio are:
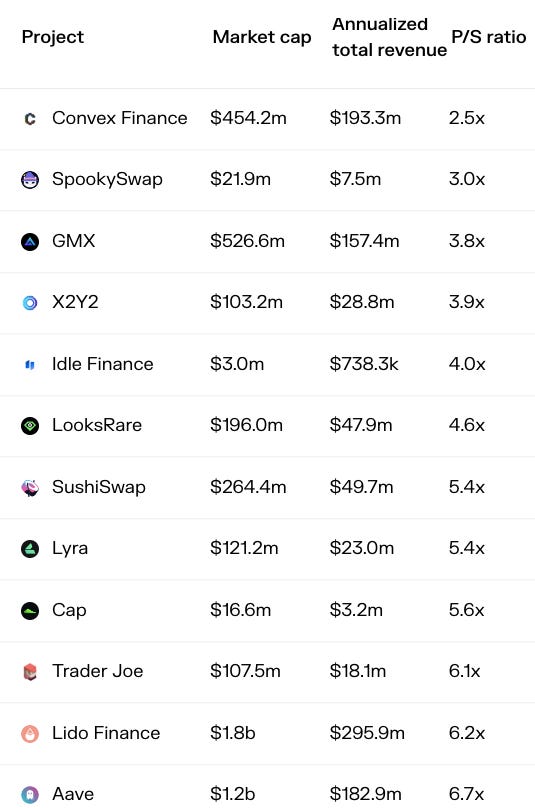
The most under-valued cryptos by P/S ratio are:
Notes
1. Some protocols have only supply-side revenue and hence their P/E ratio cannot be calculated. Example: In Uniswap (UNI), all the trading fees go to the liquidity providers (supply-side).
2. Some protocols have only protocol revenue and hence their P/S and P/E ratios are the same. Example: In MakerDAO (MKR), all interest payments go to the protocol and are distributed to MKR holders through buybacks.
3. Some protocols have both supply-side & protocol revenue and hence their P/S & P/E ratio are both available. Example: In Compound (COMP), interest payments are divided between lenders (supply-side) & the protocol's treasury which is managed by token holders.
Source: TokenTerminal. Data is as of 22nd September 2022.